Analysis and reporting: your ultimate guide
You want to see in black and white what works and what doesn't. That's why a good agency continuously tracks and analyzes key performance indicators (KPIs). Based on this data, it makes optimizations and shows you whether your investment is successful. This is where analysis and reporting come into play. In this article, you will find out why a professional database is essential for your company, what processes are behind a successful analysis and reporting strategy and how you can turn the insights gained into concrete results.
Why is analysis and reporting so important?
Because without precise data analysis, you are literally groping in the dark. Every marketing or SEO (Search Engine Optimization) measure requires a stable foundation on which you can build. Only then can you recognize which actions bring results and where you need to start in order to sustainably increase your success.
In this comprehensive article (over 2500 words), we take a deep dive into the world of analysis and reporting. You will receive practical examples, step-by-step instructions and valuable tips from an SEO and web agency perspective. By the end, you will be able to confidently design your own data analyses and use them profitably.
APALION MARKETING AG
Analysis and reporting - why it makes the difference
In this section, we take a closer look at what analysis and reporting mean and why they play a crucial role in Apalion AG's online marketing (digital marketing).
Making data-based decisions
Without a solid analysis and reporting structure, you are left to make assumptions. Good data analysis answers essential questions such as:
- Where do your visitors come from?
- Which pages are visited the most?
- Which keywords (search terms) bring you the most traffic (number of visitors)?
Once you have the answers to these questions, you can adapt your marketing strategy and increase your sales.
- Efficient budget utilization
If you know which campaigns (marketing measures) work, you can use your budget more efficiently. Analysis and reporting help you to reduce unnecessary expenditure and instead invest where the return on investment (ROI) is highest.
- Ongoing improvement
Online marketing is a dynamic environment. Trends and user behavior are constantly changing. A professional analysis and reporting system ensures that you are constantly making optimizations. You recognize trends quickly and can react immediately.
APALION MARKETING AG NEWS
„Data-driven campaigns“ is a very big topic, so there is always news.
The better you know your target group, the more tailored your content will be. This way, you can reach the people who will really benefit from your products or services.
Basics of analysis and reporting
Here you can find out the most important basics of analysis and reporting: What do you generally need to know to get started?
What does analysis mean?
Analysis essentially means collecting data, putting it into a meaningful context and drawing conclusions from it. In online marketing, this is primarily about:
Traffic data
How many people visit your website? Where do they come from?
Conversion data
How many visitors carry out a desired action (e.g. purchase, newsletter registration)?
Behavioral data
Which content do your users consume most frequently, which pages do they leave quickly?
What is meant by reporting?
While analysis focuses on data collection, reporting is about preparing this data and presenting it in an understandable way. A professional reporting system provides you with a clear overview:
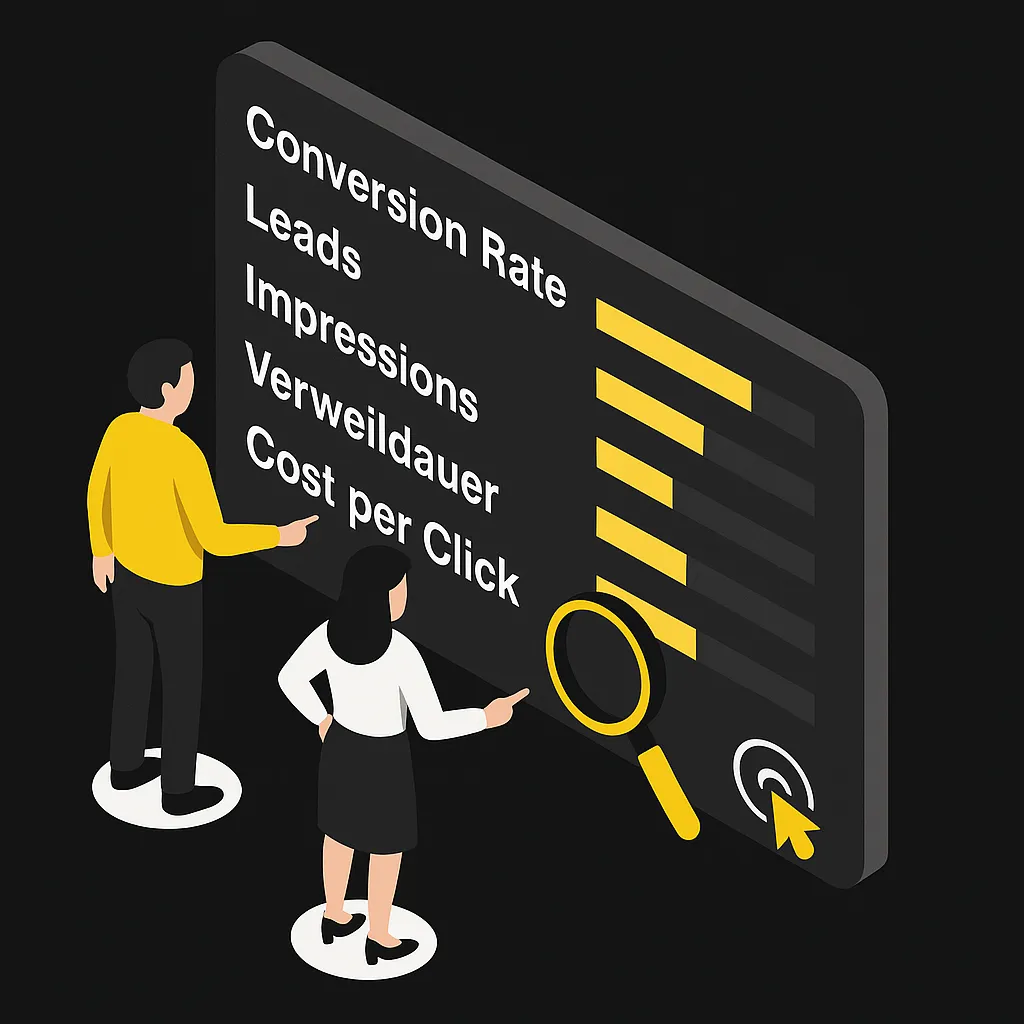
KPIs (Key Performance Indicators)
For example, conversion rate, click rate, dwell time.
Trends and developments:
Rising or falling figures become clear.
Comparisons:
Comparison of current and past data, benchmarking (comparison with other companies).
Analysis and reporting are therefore inseparable: While you create the basis with the analysis, the reporting delivers the „black on white“ result.
Start now with a free initial consultation
The most important KPIs for your marketing
Find out which KPIs you should definitely consider in your analysis and reporting to ensure the success of your campaigns.
Conversion rate
The conversion rate is the ratio of visitors to successful completions (e.g. purchases). It shows you how well your website or offer actually works.
Click-through rate (CTR)
The CTR measures how often a link or ad is clicked on in relation to the total number of impressions (visual contacts). It is particularly important for advertising campaigns in search engines or social media.
Dwell time
The dwell time provides information about how interesting your content is. If visitors stay longer on a page, this is usually an indicator of high-quality content.
Bounce rate
The bounce rate measures how many visitors leave your site immediately without visiting any other subpages. A high bounce rate can mean that your site is either not providing the right information or that it is technically too slow.
Cost per Click (CPC - price per click)
The CPC shows how much you spend on a single click in ads. This allows you to find out whether your ads are profitable.
Return on Ad Spend (ROAS)
ROAS shows how much revenue you generate per euro invested in advertising. A high ROAS means that your campaign is profitable.
Important: These key figures (KPIs) are not an end in themselves. They should serve as a tool for you to make targeted optimizations in your marketing. This is exactly what analysis and reporting is all about.
Tools for professional analysis and reporting
Recognize which tools can help you implement your analysis and reporting strategy and how to use them optimally.
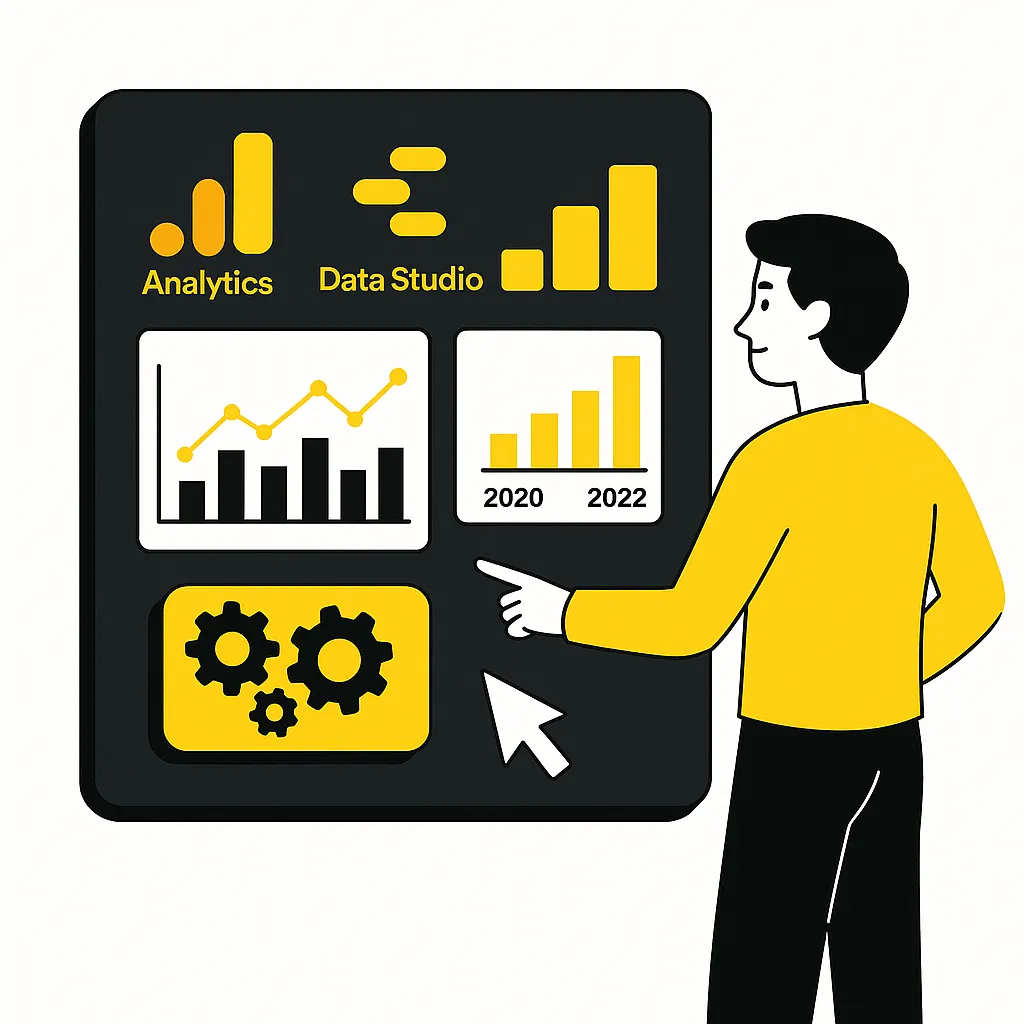
Google Analytics
Google Analytics is one of the best-known tools for tracking your website visitors. It allows you to see exactly:
Where your visitors come from (traffic sources).
Which pages are particularly popular.
How long users stay on your website.
Advantage: Free use, extensive functions.
DISADVANTAGE: Data protection (privacy) should always be observed.
Data-driven campaigns
Google Search Console
The Google Search Console provides information on search engine rankings. You can find out which keywords are used to find you and whether your site is working properly from a technical perspective. Regular analysis and reporting with the Search Console enables you to control your SEO measures (search engine optimization) in a targeted manner.
Further SEO and tracking tools
- SEMrush: Extensive keyword research, competition analysis (comparison with competitors).
- Ahrefs: Strong backlink analysis (backlink analysis), keyword rankings.
- Matomo: Formerly Piwik, offers a self-hosted web analysis solution that is particularly impressive in terms of data protection.
The process of a successful analysis and reporting strategy
A clear process ensures that you always have an overview and can optimize in a targeted manner.
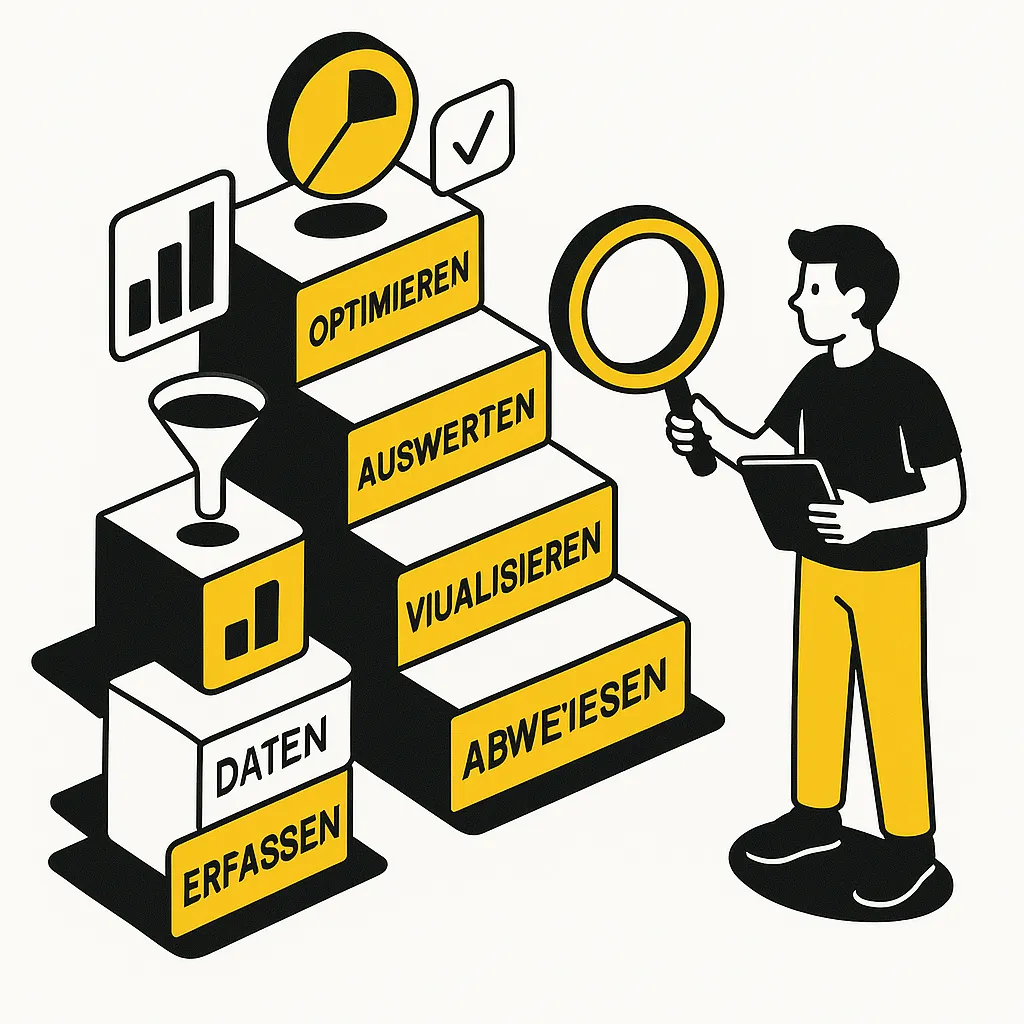
Before you start analyzing and reporting, you need clear goals: What do you want to achieve? More leads (prospective customers), higher sales or improved brand awareness? Without specific goals, you won't know which data is really relevant.
Based on your goals, you determine the most important key figures for you. These can be the ones mentioned above or completely individual metrics, depending on what you want to achieve.
Ensure that all relevant data is collected. Use a combination of Google Analytics, Tag Manager or other tools to track clicks, conversions and user behavior.
Now the actual analysis begins. You compare data, recognize patterns and look for anomalies. Questions that can guide you:
Which pages achieve high conversions?
Where do users jump off?
Which campaigns bring the most traffic?
The data obtained is presented in an understandable way. Diagrams, tables and brief explanations help you and your team to quickly draw the right conclusions.
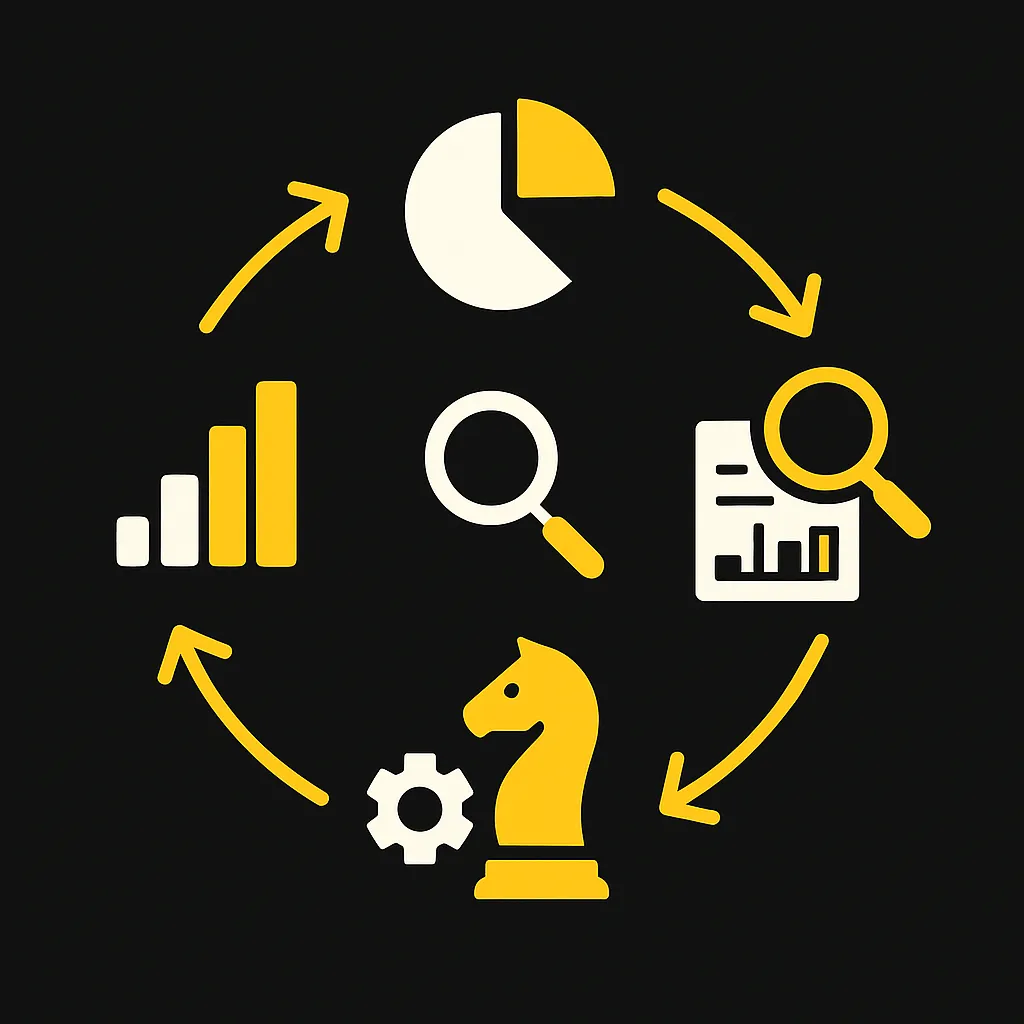
You derive concrete measures based on the reporting: Perhaps you convert a landing page (target page), change an advertising budget or optimize your SEO strategy. Then the cycle starts all over again: define goals, track data, analyze, report, optimize.
Start your project now
Would you like to finally see with crystal clarity how successful your marketing campaigns are? Then get in touch with Apalion and arrange a non-binding consultation. We'll show you how analysis and reporting can take your business to the next level!
Apalion marketing ag
Practical examples for analysis and reporting
New landing page for a product
Goal
Increase in inquiries via the contact form by 20%.
KPIs
Conversion rate for the form, time spent on the page, scroll depth (how far users scroll down).
Tool use
Google Analytics for dwell time and conversion tracking, heatmap tool (e.g. Hotjar) for scroll depth.
Results
After 2 weeks, you see that the conversion rate has increased, but the scroll depth remains low. From this, you draw the conclusion to place important content higher up on the page.
Imagine you have created a new landing page and want to know if it is delivering the desired results. Your analysis and reporting roadmap could look like this:
E-commerce store optimization
If you run an online store, reliable analysis and reporting mechanisms are essential:
Goal
Reduction of the abandonment rate in the checkout process.
KPIs
Abandonment rate per checkout step, average order value, returning customer rate.
Tool use
Google Analytics Enhanced Ecommerce or a special tool for store analytics (e.g. Shopify Analytics).
Results
You notice that many users drop out at the shipping costs step. Solution: More transparent shipping costs or free delivery from a certain order value.
Internal links to related content
Use internal links to lead your readers to related topics and services at Apalion. This will improve both the user experience and your SEO.
- SEO strategy at Apalion - Here you can find out how to get your website to the top positions in the long term.
- Web design and conversion optimization - Learn how a user-friendly design can boost your conversions.
- Content marketing for more visibility - Find out how you can increase your reach with high-quality content.
Common errors in analysis and reporting
Use internal links to lead your readers to related topics and services at Apalion. This will improve both the user experience and your SEO.
Imprecise or missing targets
Without specific goals, even the best analysis and reporting software can do little. Clearly define what you want to achieve.
No regular checks
Data is constantly changing. Only if you carry out your analysis and reporting continuously will you stay up to date.
Too many KPIs
If you try to measure everything at once, you will quickly get bogged down. Concentrate on the most important key figures. Less is often more.
Lack of implementation
A perfect analysis is useless if you don't derive any improvement measures. Make sure that your team understands the results and actively uses them.
Tips and tricks for even better analysis and reporting
Receive concrete advice on how to take your analysis and reporting to the next level and make it more efficient.
Automated reports
Set up automated email reports that regularly send you and your team relevant data. This saves you time and keeps you up to date.
Segmentation
Segment your data to gain meaningful insights. For example, differentiate between mobile and desktop visitors, new customers and existing customers.
Use comparisons
Compare your KPIs not only with previous weeks or months, but also with the same period in the previous year. This allows you to better recognize seasonal effects.
Personalize dashboards
Customize your dashboard to your individual needs. If you are a marketing manager, for example, you will be interested in different key figures than someone from IT.
Continuous learning
The world of data analysis is developing at breakneck speed. Stay up to date and regularly expand your knowledge, for example through webinars or specialist literature.
When you integrate your brand story into your content marketing and branding, you offer your target group not only information, but also inspiration.
Background knowledge
Would you like to delve deeper into the topic of online marketing in general? Then take a look at Wikipedia. There you will find a basic definition and further references to expand your knowledge.
How Apalion supports you with analysis and reporting
Setup and configuration
We professionally set up Google Analytics, Google Search Console and other tools for you. This ensures that every relevant key figure is recorded seamlessly.
Individual advice
You will receive personalized advice on which KPIs are most important for your goals and how to interpret them.
Regular reports
At agreed intervals, we provide you with detailed reports that show you at a glance what is working and where there is a need for optimization.
Ongoing optimization
⦁ Analysis and reporting are not a one-off process. We stay on top of things and adapt your strategy as soon as trends or market conditions change.
As an experienced SEO and web agency, we at Apalion attach great importance to a transparent and effective data basis. Our offer includes:
If you regularly record and evaluate your KPIs, you will quickly realize how much potential there is in your data. Analysis and reporting help you to optimally allocate resources, identify successes and make sensible optimizations. This is the best way to keep your company on course for long-term success.
Summary and outlook
A compact summary that shows you how to achieve sustainable success with analysis and reporting.
Data is the key
Only those who know where they stand can achieve their targets (key performance indicators).
Continuous process
Analysis and reporting are not a one-off action, but a constantly repeating cycle.
Professional support
With an agency like Apalion at your side, you don't experiment, but rely on tried and tested strategies.
FAQ - Frequently asked questions about analysis and reporting
Here are some typical questions that customers ask us about analysis and reporting. Perhaps this will help you if you are still unsure.
Why is analysis and reporting so important?
Without analysis, you are groping in the dark. Only with clear KPIs and structured reporting can you identify which measures are working and where there is potential for optimization.
Which KPIs are particularly relevant in online marketing?
The most important key figures include conversion rate, click-through rate (CTR), dwell time, bounce rate, cost per click (CPC) and return on ad spend (ROAS).
Which tools help me with the analysis?
Proven tools include Google Analytics, Google Search Console, SEMrush, Ahrefs and Matomo. They provide comprehensive insights into website performance, user behavior and SEO success.
How often should I analyze my data?
Regularly - ideally weekly or monthly. This is the only way to recognize trends in good time and react quickly to changes in the market.
What is the difference between KPIs and metrics?
KPIs (Key Performance Indicators) are strategically important key figures that measure your goals. Metrics are general metrics from which you can derive KPIs.

